Our Primary Strategic Investments are in MGX Resources Limited
(“MGX”, previously known as Mount Gibson Iron Limited) (ASX:
MGX), Tanami Gold NL (“Tanami Gold”) (ASX: TAM), Metals X
Limited (“Metals X”) (ASX: MLX), Dragon Mining Limited (“Dragon
Mining”) (HKEX: 1712) and Prodigy Gold NL (“Prodigy Gold”) (ASX:
PRX), where APAC Resources owns 38.4%, 46.3%, 23.3%, 24.7% and
30.7% as at 31 December 2025 respectively.
The combined net attributable profits shared from MGX, Tanami
Gold, Metals X, Dragon Mining and Prodigy Gold which are
accounted for as the Group’s associates for 1H FY25/26 was
HK$58,912,000 (1H FY24/25: net attributable loss of
HK$5,508,000).
During the period, APAC Resources’ shareholding in Prodigy Gold
rose from 29.6% as at 30 June 2025 to 30.7% as at 31 December
2025 due to subscription of the entitlement offer by Prodigy
Gold (one new share for every one share held) and underwriting
the shortfall offer at an issue price of A$0.002 per share.
MGX
APAC Resources owns 38.4% of MGX at 31 December 2025. MGX is
undergoing a business transition from an iron ore producer to a
gold developer, with the scheduled end of Koolan Island
operation in 2026 and completed acquisition of 50% interest in
the Central Tanami Gold Project Joint Venture. MGX owns the
Koolan Island mine off the Kimberley coast in the remote
north-west of Western Australia.
Due to a significant rockfall on the eastern footwall of the
main pit at Koolan Island in October 2025, mining was suspended.
The investment required to remediate the mine was not
economically justified, especially noting that mining was
scheduled to conclude around September 2026. For now, the
operations are focused on the monetization of lower grade
stockpiles, with processing and shipping of low-grade material
expected to continue to late in the June quarter of 2026.
MGX generated A$15 million free cash flow in the December
quarter of 2025 with the sales of 798,000 wet metric tonnes
(“wmt”) of iron ore (319,000 wmt of average 62.6% Fe iron ore
and 479,000 wmt of average 49.6% Fe iron ore). For the coming
two quarters, MGX targets to process and ship a further 1
million wmt of low grade (42-45% Fe iron ore) stockpiled
material, followed by a full depletion of the mine stocks.
Sales guidance for the year ending 30 June 2026 (“FY25/26”) was
withdrawn on 24 October 2025. MGX’s cash and investment reserves
was A$497 million at the end of 1H FY25/26, although this
doesn’t include the A$50 million payment made in February 2026
upon acquisition of the Central Tanami Gold Project Joint
Venture. Pro-forma MGX has A$447 million cash and investment
reserves.
The Platts Iron Ore Index 62% CFR China index traded strongly in
1H FY25/26, from mid-US$90s per dry metric tonne (“dmt”) in July
to circa US$108 per dmt in late December 2025. At time of
writing in early February 2026, the price is around US$100 per
dmt. Iron ore prices have been supported by strong Indian and
United states (“U.S.”) steel output, while China, Russia, and
European steel production has declined due to weak economic
growth. Iron ore prices are expected to fluctuate with sentiment
related to China and India’s economy.
Tanami Gold
APAC Resources owns 46.3% of Tanami Gold at 31 December 2025.
Tanami Gold’s principal business activity is gold exploration.
It holds 50% of the Central Tanami Project and has a cash
balance of A$14 million. In May 2021, Tanami Gold entered into a
binding agreement with Northern Star Resources Limited
(“Northern Star”) (ASX: NST) to establish a new 50-50 Joint
Venture covering the Central Tanami Gold Project Joint Venture.
On 3 December 2025, MGX reported that it received approval from
the Foreign Investment Review Board for an acquisition for
Northern Star’s 50% interest in Central Tanami Gold Project
Joint Venture, and the transaction was completed in February
2026.
Metals X
APAC Resources owns 23.3% of Metals X as at 31 December 2025.
Metals X is focused on implementing its life of mine plan at
Renison mine, including the development of the high-grade Area 5
deposit. In the six months ended 31 December 2025, the Renison
mine produced 2,796 tonnes of tin (net 50% basis), down 10%
year-on-year, as September quarter mill throughput was impacted
by operational downtime and equipment failures. However,
production rebounded significantly in the December quarter due
to notably higher grades and recoveries as plant operations were
more stable. Production improved in December quarter by 46%
quarter-on-quarter.
Tin prices have rallied from circa A$34,000 per tonne in early
July 2025 to circa A$48,000 per tonne at the time of writing in
late February 2026. Demand for critical mineral stockpiling,
supply challenges such as Indonesia illegal tin mine shut-downs
and Myanmar shipment delays and speculative trading activities
have all contributed to strong tin prices. We remain comfortable
with the outlook for tin due to the lack of supply growth,
growing demand for tin from the electrification trend, and
growth from semiconductors and energy storage industries.
Dragon Mining
APAC Resources owns 24.7% of Dragon Mining at 31 December 2025.
The principal activity of Dragon Mining is gold exploration,
mining, and processing in the Nordic region. Dragon Mining
operates gold mines and processing facilities in Finland and
Sweden. In Finland, the Vammala Production Centre consists of a
conventional 300,000 tonnes per annum crushing, milling and
flotation plant, the Jokisivu Gold mine, the Orivesi Gold mine
which ceased production in June 2019, and the Kaapelinkulma Gold
mine which ceased production in April 2021, and the Uunimäki
Gold project. Annual production from Dragon Mining is in the
range of 20,000 to 30,000 ounces of gold in concentrate
depending on the grade of ore and gold concentrate feed. In
Sweden, the operation is known as the Svartliden Production
Centre, consisting of a 300,000 tonnes per annum carbon-in leach
processing plant together with the closed Svartliden Gold mine
(mining completed in 2013), and the Fäboliden Gold mine where a
campaign of test-mining was completed in September 2020. On 1
April 2025, Allied Properties Resources Limited (“APRL”), a
wholly-owned subsidiary of APAC Resources, announced a
pre-conditional voluntary cash offer of HK$2.20 per share for
all issued shares of Dragon Mining not owned by APRL and its
concert parties. On 19 May 2025, Wah Cheong Development (B.V.I.)
Limited (“Wah Cheong”), an indirect wholly-owned subsidiary of
Allied Group Limited (a substantial shareholder of APAC
Resources), announced a conditional voluntary cash offer of
HK$2.60 per share for all issued shares of Dragon Mining not
owned by Wah Cheong and its concert parties. On 2 June 2025,
APRL’s offer was withdrawn. On 22 September 2025, Dragon Mining
raised HK$172.8 million via a placement of over 31.6 million
shares at HK$5.61 per share.
Prodigy Gold
APAC Resources owns 30.7% of Prodigy Gold at 31 December 2025.
Prodigy Gold is a gold exploration company listed on the
Australian Securities Exchange. It holds a large footprint of
exploration tenements in the Tanami region in the Northern
Territory, Australia, and a JORC resource of 1.03 million ounces
across its Hyperion, Tregony, Buccaneer and Old Pirate projects.
Some of its tenements are held in joint venture with partners
such as Newmont Corporation (ASX: NEM) and IGO Limited (ASX:
IGO). At the end of December 2025, Prodigy Gold has a cash
balance of A$5.2 million. The focus of Prodigy Gold for 2026
will be exploration on the Tanami North Project area and
continue with its strategy to divest non-core assets.
Financial Assets at Fair Value
through Profit or Loss
Financial assets at fair value through profit or loss comprise
mainly the Group’s Resource Investment. As at 31 December 2025,
within the Resources Investment APAC Resources had significant investment representing 5% or more of the
Group’s total assets in Shougang Fushan Resources Group Limited
(“Shougang Fushan”) (HKEX: 639).
Significant Investment
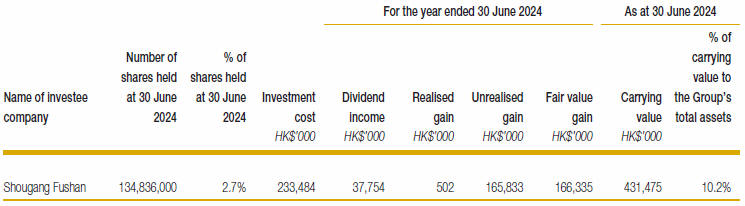
Our investment in Shougang Fushan generated a fair value gain of
HK$9,985,000 during the period with carrying value as at 31
December 2025 of HK$409,174,000.
Shougang Fushan is a coking coal producer listed on The Stock
Exchange of Hong Kong Limited. Its principal businesses are
coking coal mining and the production and sales of coking coal
products in China. It has three mines located in China with
reserves of 54 million tonnes of raw coking coal at 31 December
2024 and during six months ended 30 June 2025 Shougang Fushan
produced 2.6 million tonnes of raw coking coal and sold 1.6
million tonnes of clean coking coal.
Its results for the year ended 31 December 2025 are not yet
available at the time of writing. The market capitalisation of
Shougang Fushan in early February 2026 is around HK$16.9
billion. During the six months ended 30 June 2025, Shougang
Fushan generated revenue of HK$2,101 million and attributable
profits of HK$481 million and had cash and time deposits of
HK$9.4 billion at 30 June 2025.
Resource Investment
The investments in this segment comprise mostly minor and liquid
holdings in various natural resource companies listed on major
stock exchanges, including Australia, Canada, Hong Kong, the
United Kingdom and the U.S.. Our investments focus on select
commodities within several commodity segments: energy, bulk
commodities, base metals and precious metals.
Resource Investment posted a fair value gain of HK$1,435,886,000
in 1H FY25/26 (1H FY24/25: loss of HK$199,084,000), which, after
accounting for segment-related dividends and other investment
income and expenses, resulted in a segment profit of
HK$1,299,552,000 (1H FY24/25: loss of HK$183,612,000).
Our Resource Investment segment includes, among other investing
strategies, the two resource portfolios announced in August
2016, with an additional natural resource-focused strategy
subsequently established and focused on large caps and
specialist opportunities. The aim of the portfolios is to
produce a positive return using the Company’s funds as well as
to create a track record to attract potential third-party
investments in the future. These various portfolios are managed
under the Resource Investment segment of the Company, which is
separate from the Company’s large strategic stakes. Our
portfolios have a global long-only mandate (cannot short stocks)
and strict parameters on market capitalisation, liquidity,
development stage (exploration through to production) and
jurisdiction to manage risk.
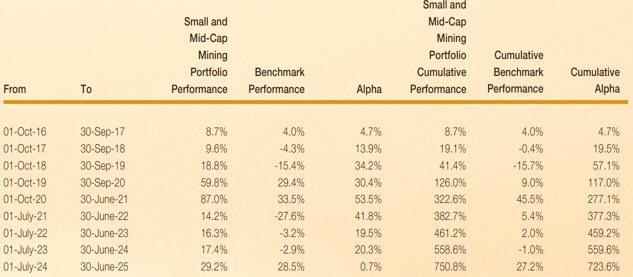
Small and Mid-Cap Mining Portfolio
This portfolio is focused on investments in small and mid-cap
companies involved in the exploration, development and
production of battery metals, base metals, precious metals,
uranium, bulks and other hard rock commodities. Managed by the
same portfolio manager since its inception in October 2016, the
Small and Mid-Cap Mining Portfolio delivered a return of 78.4%
in the six months ended 31 December 2025, which is an
outperformance of 35.0% against its benchmark, which is a
currency adjusted equal weighting of the ASX 200 Small Cap
Resources, FTSE AIM All Share Basic Resources and TSX Venture
Composite indices.
Over its full investment lifetime of October 2016 to December
2025, the portfolio has now delivered a return of 1,418%, which
is a substantial outperformance of 1,335% against its benchmark
return of 82%. A full breakdown of the Small and Mid-Cap Mining
Portfolio’s annual performance against its benchmark is
presented in the table below
The Small and Mid-Cap Mining Portfolio’s exceptional performance
for the six months ended 31 December 2025 was primarily driven
by continued high-conviction positioning in the precious metals
sector. This was supported by a robust macro backdrop for gold
given ongoing central bank buying, the de dollarisation trend,
increasing concerns around fiscal deficits and sovereign debt,
plus significantly higher investor buying (which can be fickle).
The portfolio remains focused on gold producers that are moving
into record margin expansion and cycle-high free cash flows and
this strategy has proved highly effective as investors generally
rerated these companies significantly higher. Consequently, the
list of major contributors was dominated by gold miners,
including Bellevue Gold (ASX: BGL), Equinox Gold (NYSE: EQX), St
Barbara (ASX: SBM), Kingsgate Consolidated (ASX: KCN), Meeka
Metals (ASX: MEK) and Galiano Gold (NYSE: GAU), as well as
Seabridge Gold (NYSE: SA) for leverage to its world class
Kerr-Sulphurets-Mitchell gold-copper development project.
Beyond the precious metals allocation, the portfolio also
benefited from successful stock selection in the critical
minerals space, which has received a surge in investor
attention. Governments globally are increasingly viewing
reliable supply chains through the lens of national security and
are ramping up support for key projects, including fast-track
permitting, grants, direct equity stakes, low-interest loans and
even price floors. The portfolio manager identified this trend
early and held large positions in Q2 Metals (TSX: QTWO) for its
Tier 1 Cisco lithium development project in Quebec, plus EQ
Resources (ASX: EQR), which provides unique leverage to the
global tungsten squeeze via two operating mines in turnaround
under new management.
In contrast to the breadth of positive performers, the portfolio
experienced very few loss-making positions, reflecting the
strength of the underlying commodity environment and disciplined
asset selection. Asante Gold (TSX: ASE) was the only position to
act as a material drag on performance as the portfolio generally
avoided stock specific “banana peels” during the period.
This marks the tenth consecutive period of both positive returns
and outperforming the benchmark. Despite being a long-only
strategy in higher-beta small and mid-cap companies in a highly
cyclical sector, and where the benchmark has recorded five years
of negative returns during those ten years, the portfolio has
never recorded a down year yet.
The lifetime annualised return
is now 34.2%, which compares to the benchmark averaging 6.7% per
year.
Looking ahead, the portfolio manager will continue to
focus on generating alpha by getting the commodity weightings
right via larger positions in high conviction stories that
demonstrate a combination of strong or inflecting free cash
flows, high quality development or exploration potential,
credible leadership, and compelling valuations.
Energy Portfolio
This portfolio is primarily focused on the oil, gas, power and
renewables sectors. At the end of 2019, the mandate for this
portfolio was expanded to include investments in renewables, and
with a broader sector of investments, from February 2020 (before
the full impact of the Covid-19 Pandemic) to January 2026, the
Energy Portfolio has generated a return on investment of 197%.
The investment choices in the Energy Portfolio are selected
through a combination of fundamental bottom up valuation and
analysis of the prospects for different sectors. During the
early days of the Covid-19 pandemic, the investments were
focused in companies in the green energy sector given that the
low interest rate environment was supportive of stocks with
significant growth potential. During 1H FY25/26, we have
continued to focus on companies that support base load power
(predominantly natural gas in certain countries and uranium) and
added select names that were leveraged specifically to the power
demand part of the artificial intelligent (“AI”) Data Centre
thematic. At the same time, we reduced oil exposure
significantly, on the assumption that we would see oversupply
given OPEC+ laid out a path to unwind production cuts. In 1H
FY25/26, oil price fell 7%, although admittedly oil price
performance was not as bad as we initially feared given
restocking demand from the U.S. Strategic Petroleum Reserve,
plus ongoing Chinese purchases as both strategic and commercial
stockpiles continued to grow. The energy transition continues,
particularly in select areas like Energy Storage System. At the
time of writing in February 2026, we are starting to see some
greenshoots in parts of the solar value chain as it appears the
policy overhang is starting to clear up.
Large-Cap Resources Portfolio
This portfolio is strategically focused on high-quality
investments across the broader resources sector, encompassing
leading metals miners and developers, royalty companies,
downstream material producers and physical commodities holding
vehicles. In the six months ended 31 December 2025, the
Large-Cap Resources Portfolio delivered an impressive return of
57.6%, reflecting the powerful tailwinds in the sector during
this period.
The exceptional performance was primarily driven by a strong
allocation to the precious metals sector, underpinned by a
firmly positive outlook on gold and silver (as highlighted in
our Small and Mid-Cap Mining Portfolio section). During the
period, the portfolio focused on high quality gold and silver
developers, where Hycroft Mining (NASDAQ: HYMC) and NovaGold
Resources (NYSE: NG) have been the top contributors of the
portfolio’s performance. Holdings of established precious metals
producers, including Coeur Mining (NYSE: CDE), Equinox Gold
(NYSE: EQX), IAMGOLD (NYSE: IAG), Newmont Corporation (NYSE:
NEM), also contributed to the portfolio’s extraordinary return
in the period.
During the period, there were a few loss-making positions,
including Asante Gold (TSX: ASE) and Allied Gold (TSX: AAUC),
which had experienced volatility driven by risks associated with
operating in less stable jurisdictions such as Ghana and Mali.
However, we see asymmetric risk-reward with the compelling
company valuations, considering the massive cash flow generated
under a resilient gold and silver price environment.
Looking ahead, the portfolio will maintain its emphasis on
sectors experiencing a cyclical upturn, with a selective,
rigorous approach to identifying high quality companies that
offer attractive risk reward profiles. This disciplined strategy
positions the portfolio to continue capitalizing on the
favorable dynamics in resources and precious metals.
Precious Metals
Precious Metals (majority gold exposure) generated a net fair
value gain of HK$1,139,861,000 in 1H FY25/26 (1H FY24/25:
HK$55,082,000). As at 31 December 2025, the carrying value of
the Precious Metals segment was HK$2,110,989,000 (As at 30 June
2025: HK$1,045,084,000). Our largest gold investment in the
Resource Investment segment is in Northern Star (ASX: NST) which
generated a fair value gain of HK$44,123,000 with a carrying
value as at 31 December 2025 of HK$139,310,000. We also own
Westgold Resources (ASX: WGX) which generated a fair value gain
of HK$56,510,000 with a carrying value as at 31 December 2025 of
HK$100,691,000. Northern Star is the largest gold company in
Australia and owns high-grade underground mines in Western
Australia and Alaska. In 1H FY25/26, its production was 728,000
ounces of gold, and it generated a net mine cash flow of A$313
million. In FY25/26, its production target is 1,600,000 -
1,700,000 ounces.
The gold price had a strong rally in 1H FY25/26 from
approximately US$3,300 per ounce and reached a high of US$4,500
per ounce before ending the year at around US$4,300 per ounce.
There is speculation that the strong gold price has been driven
by central bank purchases, safe haven demand amid worries on
geopolitical tensions and expectations that global monetary
policies would loosen.
Bulk Commodities
The Bulk Commodities segment generated a
net fair value gain of HK$47,222,000 in 1H FY25/26 (1H FY24/25:
net loss of HK$128,771,000). As at 31 December 2025, the
carrying value was HK$539,379,000 (As at 30 June 2025:
HK$492,600,000). Our largest investment in this segment during
1H FY25/26 is in Shougang Fushan (HKEX: 639), which generated a
fair value gain of HK$9,985,000 and had a carrying value as at
31 December 2025 of HK$409,174,000.
Base Metals
The Base Metals segment (a mix of copper,
nickel, zinc, aluminium, tin and cobalt companies) delivered a
net fair value gain of HK$88,407,000 in 1H FY25/26 (1H FY24/25:
net loss of HK$21,592,000). As at 31 December 2025, the carrying
value was HK$300,619,000 (As at 30 June 2025: HK$112,239,000).
During the period, base metal prices were strong, with copper
prices up 24.3%, nickel prices up 10.2%, and zinc prices up
12.7%. The Base Metals segment includes our investment in Lundin
Mining Corp (TSX: LUN) which generated a fair value gain of
HK$29,911,000 and had a carrying value as at 31 December 2025 of
HK$58,674,000.
Energy
The Energy segment (mix of oil and gas,
uranium and renewables) had a net fair value gain of
HK$47,444,000 in 1H FY25/26 (1H FY24/25: net loss of
HK$61,989,000). As at 31 December 2025, the carrying value was
HK$232,745,000 (As at 30 June 2025: HK$163,539,000). Our
significant Energy investments include Paladin Energy Limited
(ASX: PDN), which generated a fair value gain of HK$24,778,000
and had a carrying value as at 31 December 2025 of
HK$63,734,000.
Others
We also have a net fair value gain of
HK$114,501,000 from the remaining commodity (diamonds,
manganese, rare earths, lithium and mineral sands among others)
and non commodity investments in 1H FY25/26 (1H FY24/25: net
loss of HK$42,952,000). As at 31 December 2025, the carrying
value was HK$254,863,000 (As at 30 June 2025: HK$113,034,000).
Commodity Business
We have an iron ore offtake at Koolan
Island, and we continue to look for new offtake opportunities
across a range of commodities. For 1H FY25/26, our Commodity
Business generated a segment gain of HK$44,040,000 (1H FY24/25:
loss of HK$6,468,000).
Principal Investment and Financial Services
The Principal Investment and Financial
Services segment, which covers the income generated from loan
receivables and other financial assets. For 1H FY25/26, this
segment recognised a profit of HK$5,732,000 (1H FY24/25: profit
of HK$3,597,000).
Money Lending
Business Model and Customer Profile
The Group provides both secured and unsecured term loans to its
customers under its Principal Investment and Financial Services
segment. Money lending activities diversifies the income stream
and business risks of the Group, and generates a stable return
with the Group’s available financial resources on hand from time
to time. The Group mainly financed its money lending business by
its internal resources.
The Group does not set a specific target for the industry,
business or level of annual revenue to corporate borrowers. The
customers of the Group’s lending business were referred to the
Group through its corporate or business networks. For 1H
FY25/26, customer of the Group’s lending business included a
Hong Kong listed company for an unsecured loan.
Outstanding loan receivables net of loss allowances as at 31
December 2025 amounted to HK$7,298,000 (As at 30 June 2025:
HK$83,578,000). During the period, the Group has written back
impairment losses on its loan receivables of HK$5,683,000 (1H
FY24/25: impairment losses of HK$588,000). Details of a loan
outstanding as at 31 December 2025 are disclosed in note 15 to
the interim condensed consolidated financial information.
Risk Management Policies
The Group adopts a thorough credit assessment and approval
process, and will assess and approve each loan transaction on a
case-by-case basis. The finance department of the Group (the
“Finance Department”) is responsible for conducting a background
check on the prospective borrower in compliance with the
applicable laws and regulations, reviewing the background and
financial strength of such borrower and where applicable, the
guarantor, and enquiring the prospective borrower about the
purpose of the loan and the expected source of funds for loan
repayment. To support its analysis, the Group will obtain
corporate documents, financial statements and search reports of
the borrower and/or the guarantor, and thereafter, assess the
credit risk of the loan and negotiate the terms thereof after
considering (i) the background and financial position of the
borrower or the guarantor (if applicable), including net asset
value and gearing ratio; and (ii) the value of the securities,
if any.
Each loan transaction will be approved by either the Board, or
if the loan principal does not exceed the threshold set by the
Board, by the executive committee of the Board.
The Finance Department monitors the loan and interest repayment
regularly and reviews the annual financial statements of the
borrowers and guarantors (if applicable). It would promptly
report to the chief executive or chief financial officer of the
Group for any delay or default in repayment upon maturity, who
would then formulate plans for loan collection, including but
not limited to requesting for additional securities or
initiating legal actions.
Loan Impairment Policies
The Company adopts expected credit loss allowances (“ECLs”)
according to the requirements of Hong Kong Financial Reporting
Standard 9 issued by the Hong Kong Institute of Certified Public
Accountants. Accordingly, it shall review the recoverable amount
of each loan at the end of each reporting period to ensure that
adequate impairment losses are made. The Group applies a general
approach on loan receivables to assess for the ECLs.
Assessment is done based on the Group’s historical credit loss
experience, adjusted for factors that are specific to the
borrower. In order to measure the ECLs of loan receivables, the
Group will apply a credit rating for each of its borrowers by
reference to each borrower’s past default records, current past
due exposure, an analysis of its current financial position,
likelihood or risk of a default, an assessment on any
significant increase in credit risk, and fair value of
collaterals (if any), and adjust for forward looking information
that is available without undue cost or effort, such as the
current and forecasted global economy and the general economic
conditions of the industry in which the borrower operates.
The Group regularly monitors the effectiveness of the criteria
used to identify whether there has been a significant increase
in credit risk and revises them as appropriate to ensure that
the criteria are capable of identifying any significant increase
in credit risk before the loan amount becomes past due.
Forward Looking Observations
For FY25/26, we remain cautious on the
near-term macro outlook, anticipating a prolonged period of high
market volatility given fluctuations in U.S. trade policies,
geopolitical tensions, fiscal and monetary decisions around the
globe. While the U.S. economy has shown resilience driven by
strong AI investments, the slowing income growth and weak labor
market have driven concern of a gradual turnaround for the
economy’s strength. Mixed economic data points lead to
difficulties in an interest rate cut decision. At the same time,
while China achieved the strong GDP target in 2025, the
sustainability of the growth rate is unclear to us, as a strong
revival in Chinese domestic consumption and property sector is
yet to be seen. We would not discount a potential strong policy
response from the Chinese government to boost the domestic
economy although this doesn’t appear to be a high priority right
now. We believe that precious metals investment demand will
continue to be strong amid the uncertainties around global
economy and rising U.S. debt levels. At the same time, we take a
selective approach on other commodities, which benefit from
structural trends such as energy transition and increasing AI
activity and supportive medium term policies changes, such as
increasing critical metals investment, expansion of strategic
reserves and loosening policy constrains (for example on nuclear
plants). By investing in high quality opportunities, we aim to
deliver attractive returns over the long run with our mining and
energy investment portfolios. We are also excited in the
business transition of our largest investment, MGX, from an iron
ore producer to a gold developer via the recent acquisition of
the 50% interest in the Central Tanami Gold Project Joint
Venture, which could unlock value by advancing the project with
2.8 million ounces high grade gold resources.
|